
Overview of x64 stack
static RSP
- On x64 CPU, RSP register serves as both frame pointer and stack pointer, all the stack references are performed based on RSP as a result both local variables and parameters are referenced using RSP.
- The POP/PUSH instructions alter the RSP, because of this very fact, x64 permits changes to RSP only in function prologue and epilogue. The convention restricts use of any instruction that changes the state of RSP in the function code hence RSP value is kept static throughout the execution of function code.
caller/callee saved registers
According to x64 convention Non Volatile registers are expected to be saved and restored by the function that uses them. On the other hand, as the name suggests the Volatile register states are expected to change through out the execution of any function.
| Volatile Registers | RAX | RCX | RDX | R8 | R9 | R10 | R11 | XMM0 | XMM1 | XMM2 | XMM3 | XMM4 | XMM5 | ||||||
| Non Volatile Registers | RBX | RBP | RDI | RSI | RSP | R12 | R13 | R14 | R15 | XMM6 | XMM7 | XMM8 | XMM9 | XMM10 | XMM11 | XMM12 | XMM13 | XMM14 | XMM15 |
leaf & non-leaf functions
- Non-leaf functions are those functions that alter the state of non-volatile register like RSP. On X64 system, when one function calls another function then RSP value changes. Thus functions that call other functions are considered to be non-leaf functions.
- On the other hand, a leaf function is any function that doesn’t change any non-volatile registers. Simply put these functions don’t call any other function in the code.
The notion of leaf/non-leaf functions play a major role in exception handling and stack unwinding. When an exception is handled, the system needs to recover the state of non-volatile registers and also revert all the changes made to the stack by the functions, since non-leaf functions change the state of non-volatile registers and stack, the system stores all the changes performed by non-leaf functions in the binary itself in a special section in the PE file designated as .pdata or procedure data. This helps the system to revert all the changes and unwind the stack at the time of an exception. The RUNTIME_FUNCTION, UNWIND_INFO and UNWIND_CODE are the data structures that make the .pdata section. More on this later.
items on the stack
Almost all the programming languages that are popular in the IT domain fall into imperative programming language classification, to be specific Procedural Programming it is. The high level code gets compiled into subroutines/functions where execution is mainly dictated by the calls made to the sub routines. At the lowest possible level of code implementation on the CPU, there is no notion of “function”, its just a high level abstraction to conceal the stack. The stack implements functions, scope and all the associated intricacies of procedural code execution.
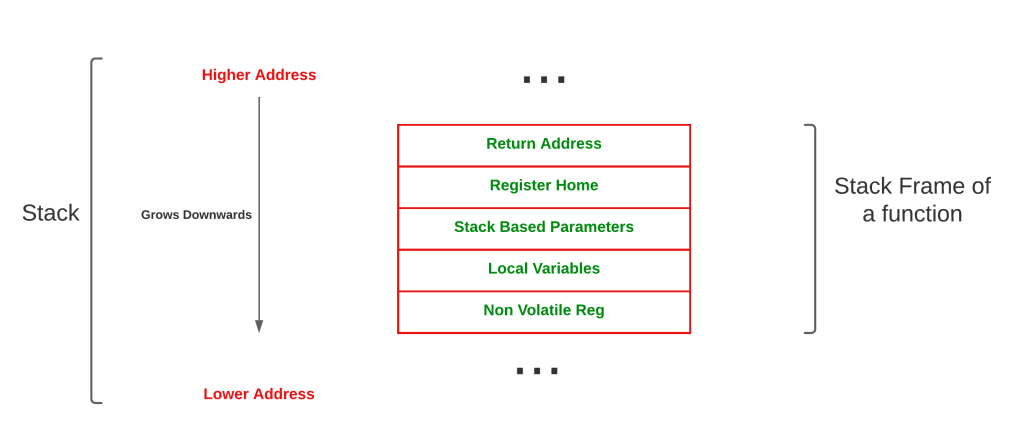
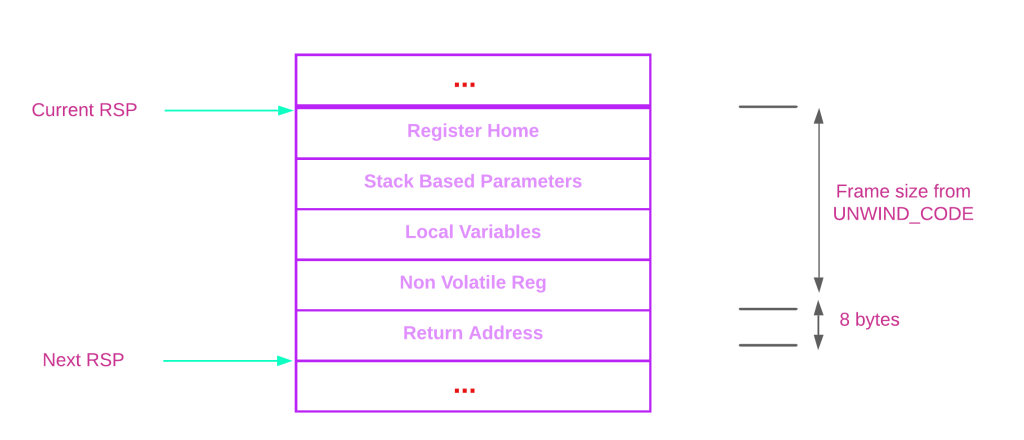
It is the responsibility of the Operating System to provide stack memory for applications during the runtime (process). Thus threads can make use of the allocated stack for code execution. The image shown below is a very high level representation of x64 stack.
stack frames
The code execution in any process can be seen as sequence of function calls, thus given current executing function, we can backtrack and reach the origin of a specific function; the code that started the execution. This is possible because of stack frames and process of performing a backtrack operation is called stack-walking. The term stack unwinding is synonymous to stack-walking but its side effect is different from a simple walk, when the stack is unwound, the runtime removes the function entries from the stack thus destroying everything on the stack until the frame where an exception handler is registered by the user/compiler to rectify the issue. We will cover this aspect in the exception handling section.
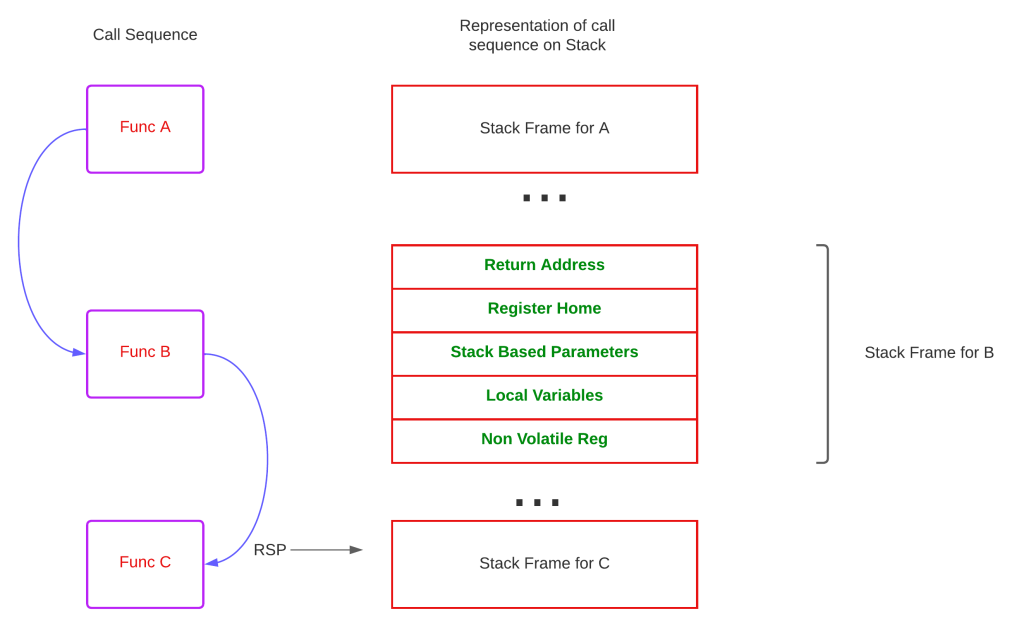
The above image depicts the call invocation sequence at stack level. The recent call is being made by the function Func-B, calling into Func-C. Therefore the RSP points to the stack frame of Func-C. The caller’s responsibility is to push the return address and pass arguments values to the callee, other than that all of the items present in the stack frame are placed by the prologue of the callee. Keep in mind, on X64 CPU RSP is fixed after the execution of the prologue, and restricts any changes made to the RSP by the function code.
The contents of the stack frame are mentioned below.
register homing
- On x64 system, the caller passes first four arguments via RCX, RDX,R8 and R9 (fastcall registers) and rest are being pushed to the stack. The callee (non-leaf) allocates 20 bytes of space called homing space in its stack frame to store values passed via fastcall register if it wants to access the parameters by address or if the function is compiled with /homeparams flag.
- Sometimes compiler stores non-volatile registers in the homing space, when its not used for storing parameter values.
Stack based parameters
These are the remaining argument values left after passing arguments via fastcall registers.
locals
Local variables used by the callee
non-volatile registers
Non Volatile registers pushed to stack by the callee.
Note : Except return address everything else seen on the stack are placed by the callee at the time of execution of the prologue.
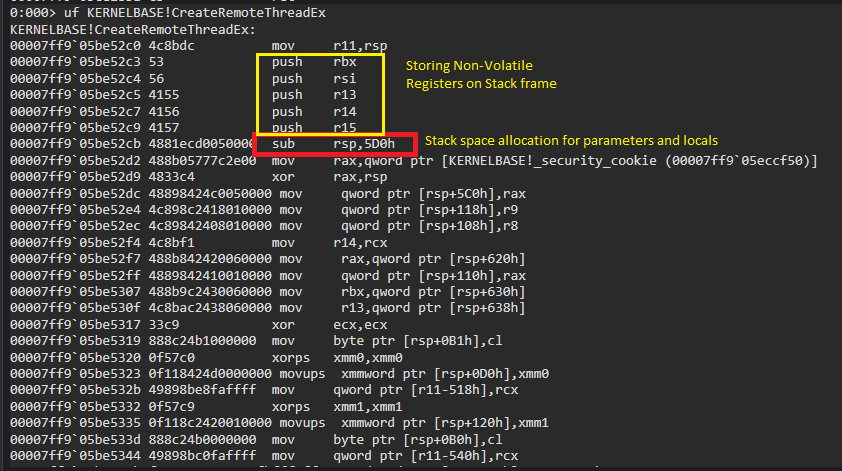
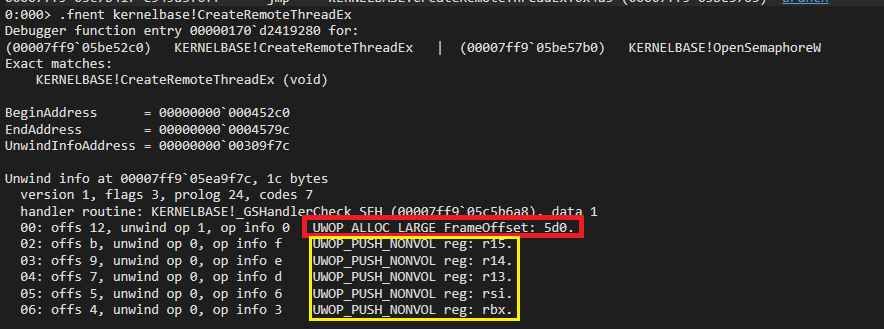
The image below shows the disassembly for the API CreateRemoteThreadEx, the highlighted instructions belong to the functions prologue. In x64 applications, the instruction sub rsp, xxx is common because it allocates the stack to accommodate both parameters and locals used by the function, past this very instruction the x64 convention restricts any modifications to state of RSP. We can also see prologue pushing Non-Volatile registers on to the stack. As it is evident from the image, the api CreateRemoteThreadEx needs 0x5D0 bytes to store locals and parameters on its stack frame.
The space utilization information can be retrieved by executing .fnent command on the api. More on this later as this piece of information to the understanding of stack walking process.

Exception handling & stack unwinding
Windows provide two main ways to deal with exception or unanticipated errors at run time and theses are Structured Exception Handling (SEH) and Vectored Exception Handling. We are not going to see exception handling in this post but its worth mentioning when we talk about stack. This topic is elaborately covered in the famous article published by Matt Pietrek a long time ago. Check reference.
When the system raises an exception, first thing that runtime does is to start undoing everything until the point where a handler registered for handling that exception is found. THIS is exception handling in a nut shell. This is happens on the stack and this backtracking performed by runtime to find an appropriate handler is called stack unwinding. The stack is unwound in the direction from the most recent frame, moving backwards (or say moving towards higher stack address ), to the frame where handler is present. The unwinding from an exception causes all items on the stack below the handling frame’s stack region to be removed thus reverting all the changes as if nothing happened at all.
The disassembly of ntdll!LdrDoDebuggerBreak api on x86 system, stack based exception frames are used for exception handling as is the case with call to ntdll!_SEH_prolog4.
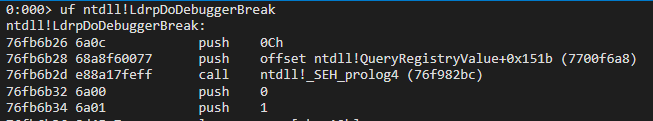
The assembly of same api for x64 CPU doesnt have SEH code as seen before. So how is the exception handling implemented in x64 applications?
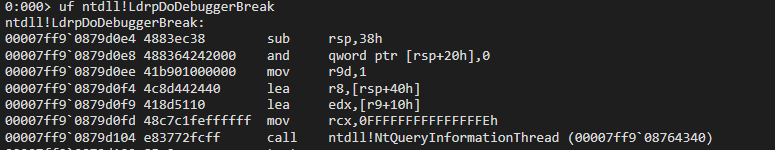
The x64 applications use special data structure RUNTIME_FUNCTION along with current RIP to perform exception handling. For every non-leaf function, there is one RUNTIME_FUNCTION structure that has all information records needed at the time of exception handling.
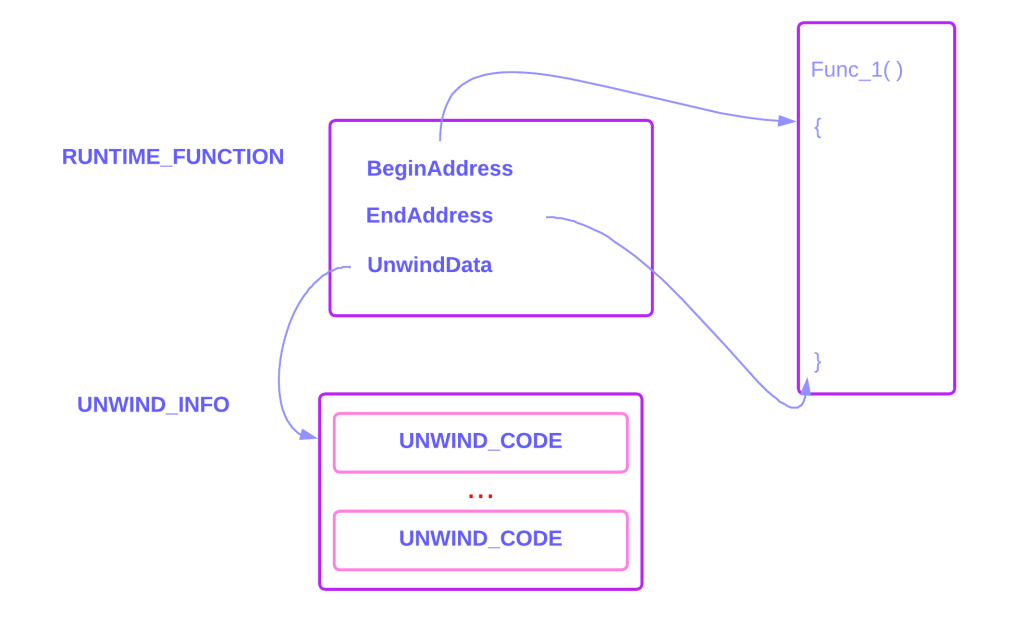
The RUNTIME_FUNCTION structure has three members:
- BeginAddress: Relative start address of the function.
- EndAddress: Relative end address of the function.
- UnwindData: The unwind data info structure is used to record the effects a function has on the stack pointer, and where the nonvolatile registers are saved on the stack. It has a special array called UNWIND_CODE which is used to record the sequence of operations in the prolog that affect the nonvolatile registers and RSP.
Note : Runtime uses the current value of RIP, BeginAddress and EndAddress to locate the function where at the exception has occurred. This way it can retrieve the correct RUNTIME_STRUCTURE for the target function.
Below table summarizes unwind codes available on the system.
| UWOP_PUSH_NONVOL | UWOP_ALLOC_LARGE |
| UWOP_ALLOC_SMALL | UWOP_SET_FPREG |
| UWOP_SAVE_NONVOL | UWOP_SAVE_NONVOL_FAR |
| UWOP_SAVE_XMM128 | UWOP_SAVE_XMM128_FAR |
| UWOP_PUSH_MACHFRAME |
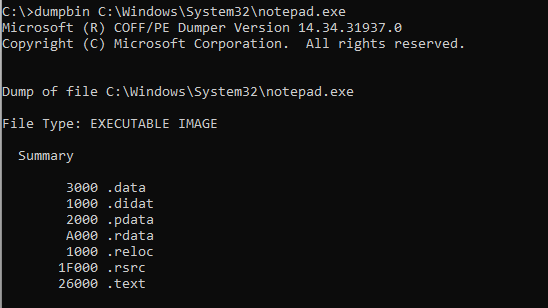
Where is this RUNTIME_FUNCTION structure and associated data are stored?
The PE files compiled for x64 CPU has one section called .pdata (procedure data) where all the RUNTIME_FUNCTION structure for all non-leaf functions are stored. The runtime can fetch unwind information needed for exception handling from here.
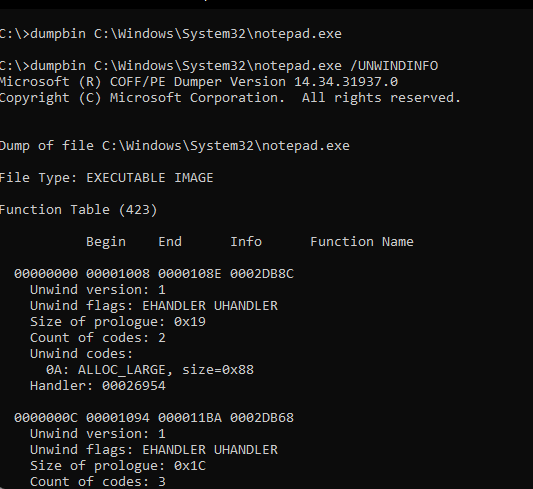
The /UNWINDINFO option in dumpbin utility shows all the RUNTIME_FUNCTION structure stored in the binary for all the non-leaf functions as shown below.
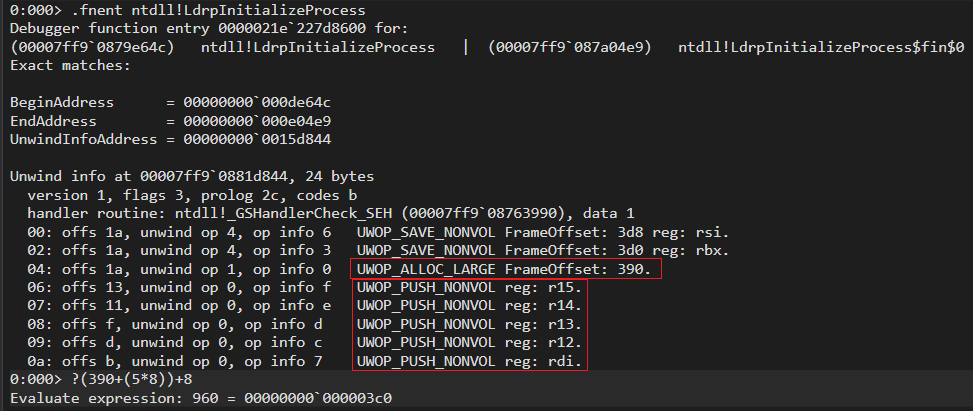
The command .fnent mentioned in the image below can be also used to parse the RUNTIME_FUNCTION structure for a specific function from pdata.
call stack walking
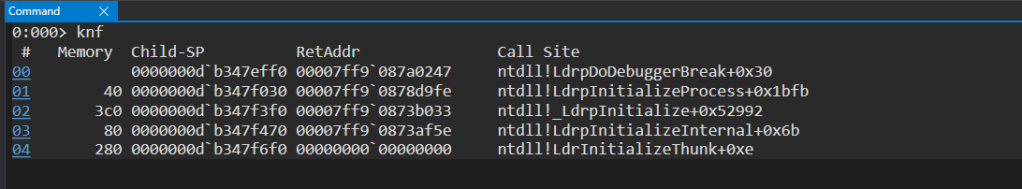
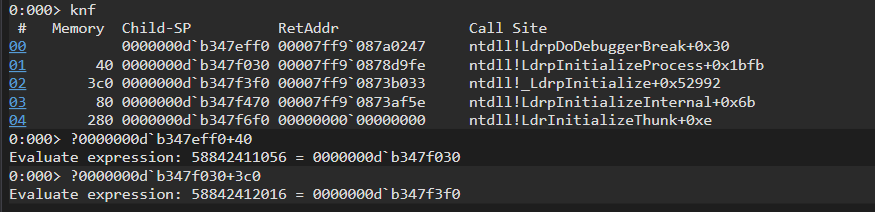
Above image (knf command) shows the call stack of 64 bit notepad when executed via WinDbg. The debugger breaks at the entry point of notepad. To interpret this information, we need to understand the direction of the call, we need to look at the frames from bottom to top. The top from is the most recent call made by the thread and the bottom most entry is the origin of the call sequence. That gives us ntdll!LdrpDoDebuggerBreak+0x30 as the recent function call and ntdll!LdrInitializeThunk+0xe as the origin from where the call chain started. Debuggers shows the call stack by walking the stack of a thread using the information provided in the RUNTIME_FUNCTION structures for every non-leaf functions in the .pdata section. In the case of x32, as discussed in the beginning debuggers use EBP stack frame register to parse the chain of pointers to form call stack of a particular thread.
Lets go through each column values in the output of knf command.
| Column Value | Description |
| # | Stack frame number |
| Memory | Memory consumed by each stack frame. Note: Memory consumed by a frame is shown in the one line below the frame of interest in Memory column. Eg frame size of frame 00 is 0x40 bytes and 01 is 0x3C0 |
| Child-Sp | The value of the RSP after execution of the function prologue. The value never changes after this point. |
| RetAddr | Return address pushed by the caller. Eg: The return address 00007ff9`087a0247 mentioned in the frame 00 is really the address that points to ntdll!LdrpInitializeProcess+0x1bfb. This is because of the direction of the call sequence and layout of the call stack as mentioned in Call Stack Walking section above. |
| Call Site | The exact location in the code where a call happens. |
To perform stack walking, one must know the size of each frame present in the call chain. This information can be obtained from RUNTIME_FUNCTION structure, to be specific we need information stored in the UNWIND_CODE structures.
frame_size = (space allocated for locals and parameters) +
(8*(Number of Non-Volatile registers pushed to stack))

Note: We can get this information from UNWIND_CODE structure
We need to consider only following UNDWIND_CODES
| Unwind Code | Size Description |
| UWOP_ALLOC_SMALL | (info * 8) + 8 will give actual size required for both locals and params. Note: Debugger output will show info field value for an UWOP_ALLOC_SMALL code |
| UWOP_ALLOC_LARGE | Debugger will show FrameOffset value for a given UWOP_ALLOC_LARGE code which will be the size required for both locals and params. |
| UWOP_PUSH_NONVOL | Each of this code will consume 8 bytes |
| UWOP_SAVE_NONVOL | This doesn’t contribute to stack size hence can be ignored. |
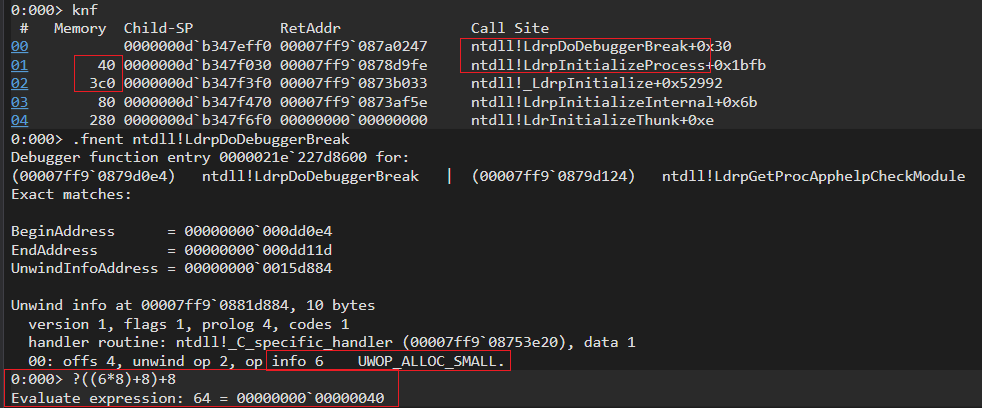
To demonstrate the stack walking process, lets calculate the frame size of the frame 00 which is ntdll!LdrpDoDebuggerBreak and ntdll!LdrpInitializeProcess.
- Reading the UNWIND_CODE of ntdll!LdrpDoDebuggerBreak reveals UWOP_ALLOC_SMALL code for allocating space for locals and parameters on the stack frame. The info value is 6, thus using our formula mentioned in the table before, the total size needed for locals and parameters is alloc_size= ((6*8)+8). Now total frame size is alloc_size + return_address_size (8) which gives the result 0x40 bytes. This value is same as the value shown under Memory column for frame 00
Now lets calculate the frame size of frame 01 which is ntdll!LdrpInitializeProcess
- As shown above, the UWOP_ALLOC_LARGE gives us 0x390 bytes for alloc_size to store locals and parameters on the stack.
- Here there are 5 UWOP_PUSH_NONVOL code used for pushing non-volatile registers on stack hence we need to take this into account in memory calculation.
- Final calculation is 390+(number_of_UWOP_PUSH_NONVOL*8) + 8 (return address). Which gives a value of 0x3C0. You can go and check knf output to verify the value.
Debugger adds the frame size to the value of the Child-Sp in frame 00 to get Child-Sp value in frame 01 and so on. This calculation is shown below. This way we can walk over the call stack and retrieve the call sequence.
conclusion
In this next post, we will discuss about call stack spoofing. This post will serve a crucial role in understanding more advanced topics like call stack spoofing. I hope you have now a clear picture of x64 stack internals.
reference
https://learn.microsoft.com/en-us/cpp/build/x64-calling-convention?view=msvc-170
https://learn.microsoft.com/en-us/cpp/build/exception-handling-x64?view=msvc-170
https://codemachine.com/articles/x64_deep_dive.html
A Crash Course on the Depths of Win32 Structured Exception Handling by Matt Pietrek
https://www-user.tu-chemnitz.de/~heha/hsn/chm/Win32SEH.chm/Win32SEH.htm
https://learn.microsoft.com/en-us/windows/win32/api/winnt/ns-winnt-runtime_function
